Understanding the Energy Transition: A Playful Approach to Expanding Renewable Energy
October 28 - 2026
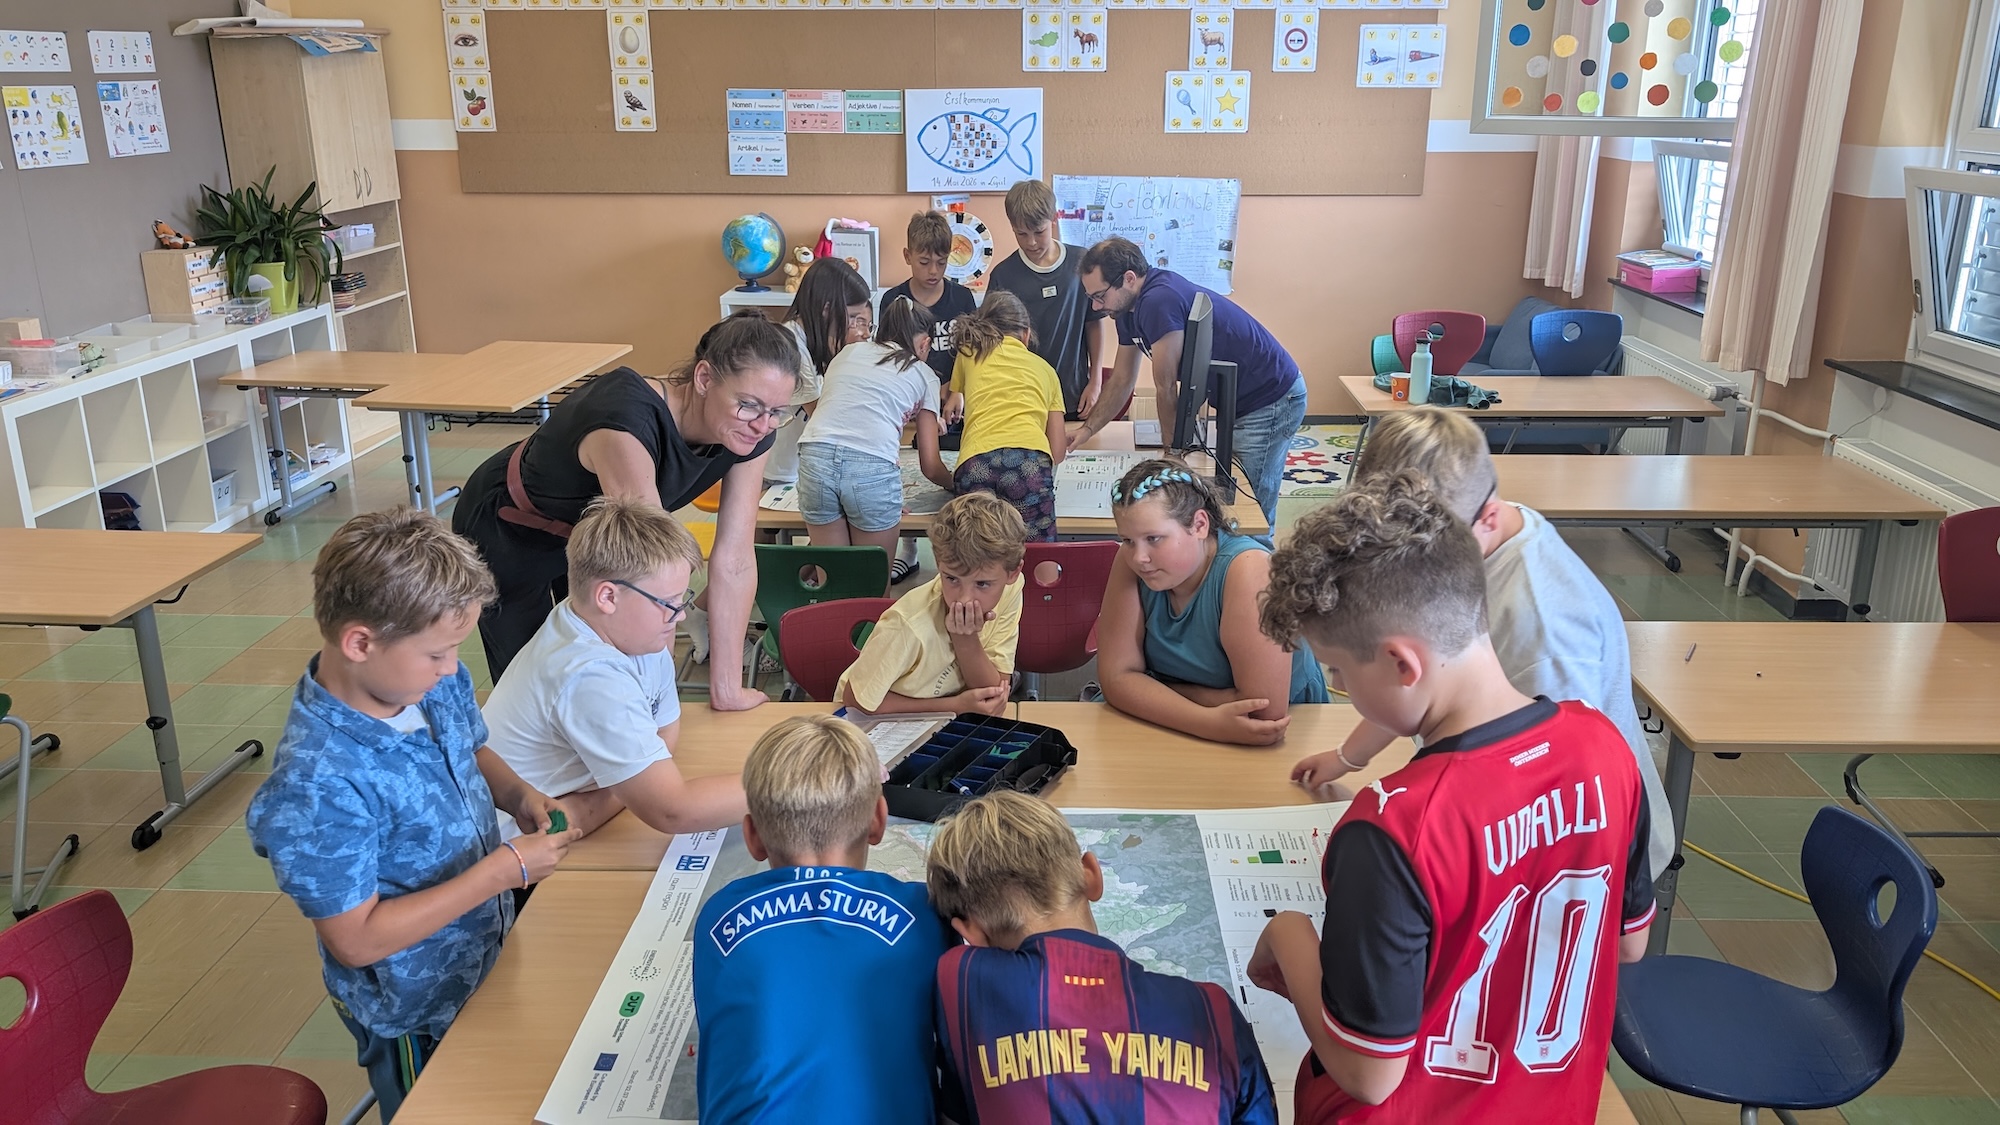
In recent years, renewable energy facilities such as photovoltaic systems have been developed in many places, perhaps in your region too. Some forms, like wind turbines, are clearly visible. Others seem to blend seamlessly into our landscape, for instance the use of forests (wood) for energy generation. This article describes a playful approach to getting familiar with different renewable energy technologies, the selection of suitable or possible sites, and the energy demand of Austrian municipalities.
The starting point was an existing concept developed by Hartmut Dumke as part of his dissertation “Renewable Energies for Regions – Demand and Competition for Land” (2017). The game board is a map of a selected region in Austria. Different renewable energy technologies are represented by pins or tokens that can be placed on the board. The facility configurations are stored in a spreadsheet, which shows how much the placed facilities contribute to the region’s existing energy demand. The goal is to cover the region’s entire energy demand with renewable energy.
This concept was taken up and developed further within the Energy4All project. First, we identified potential target groups for the planning game in conversations with the case-study municipalities. Two use cases emerged:
- Strategy development at the regional and municipal level with political decision-makers and other stakeholders
- Conveying the complex relationships between energy demand, energy supply and their spatial distribution to children and laymen
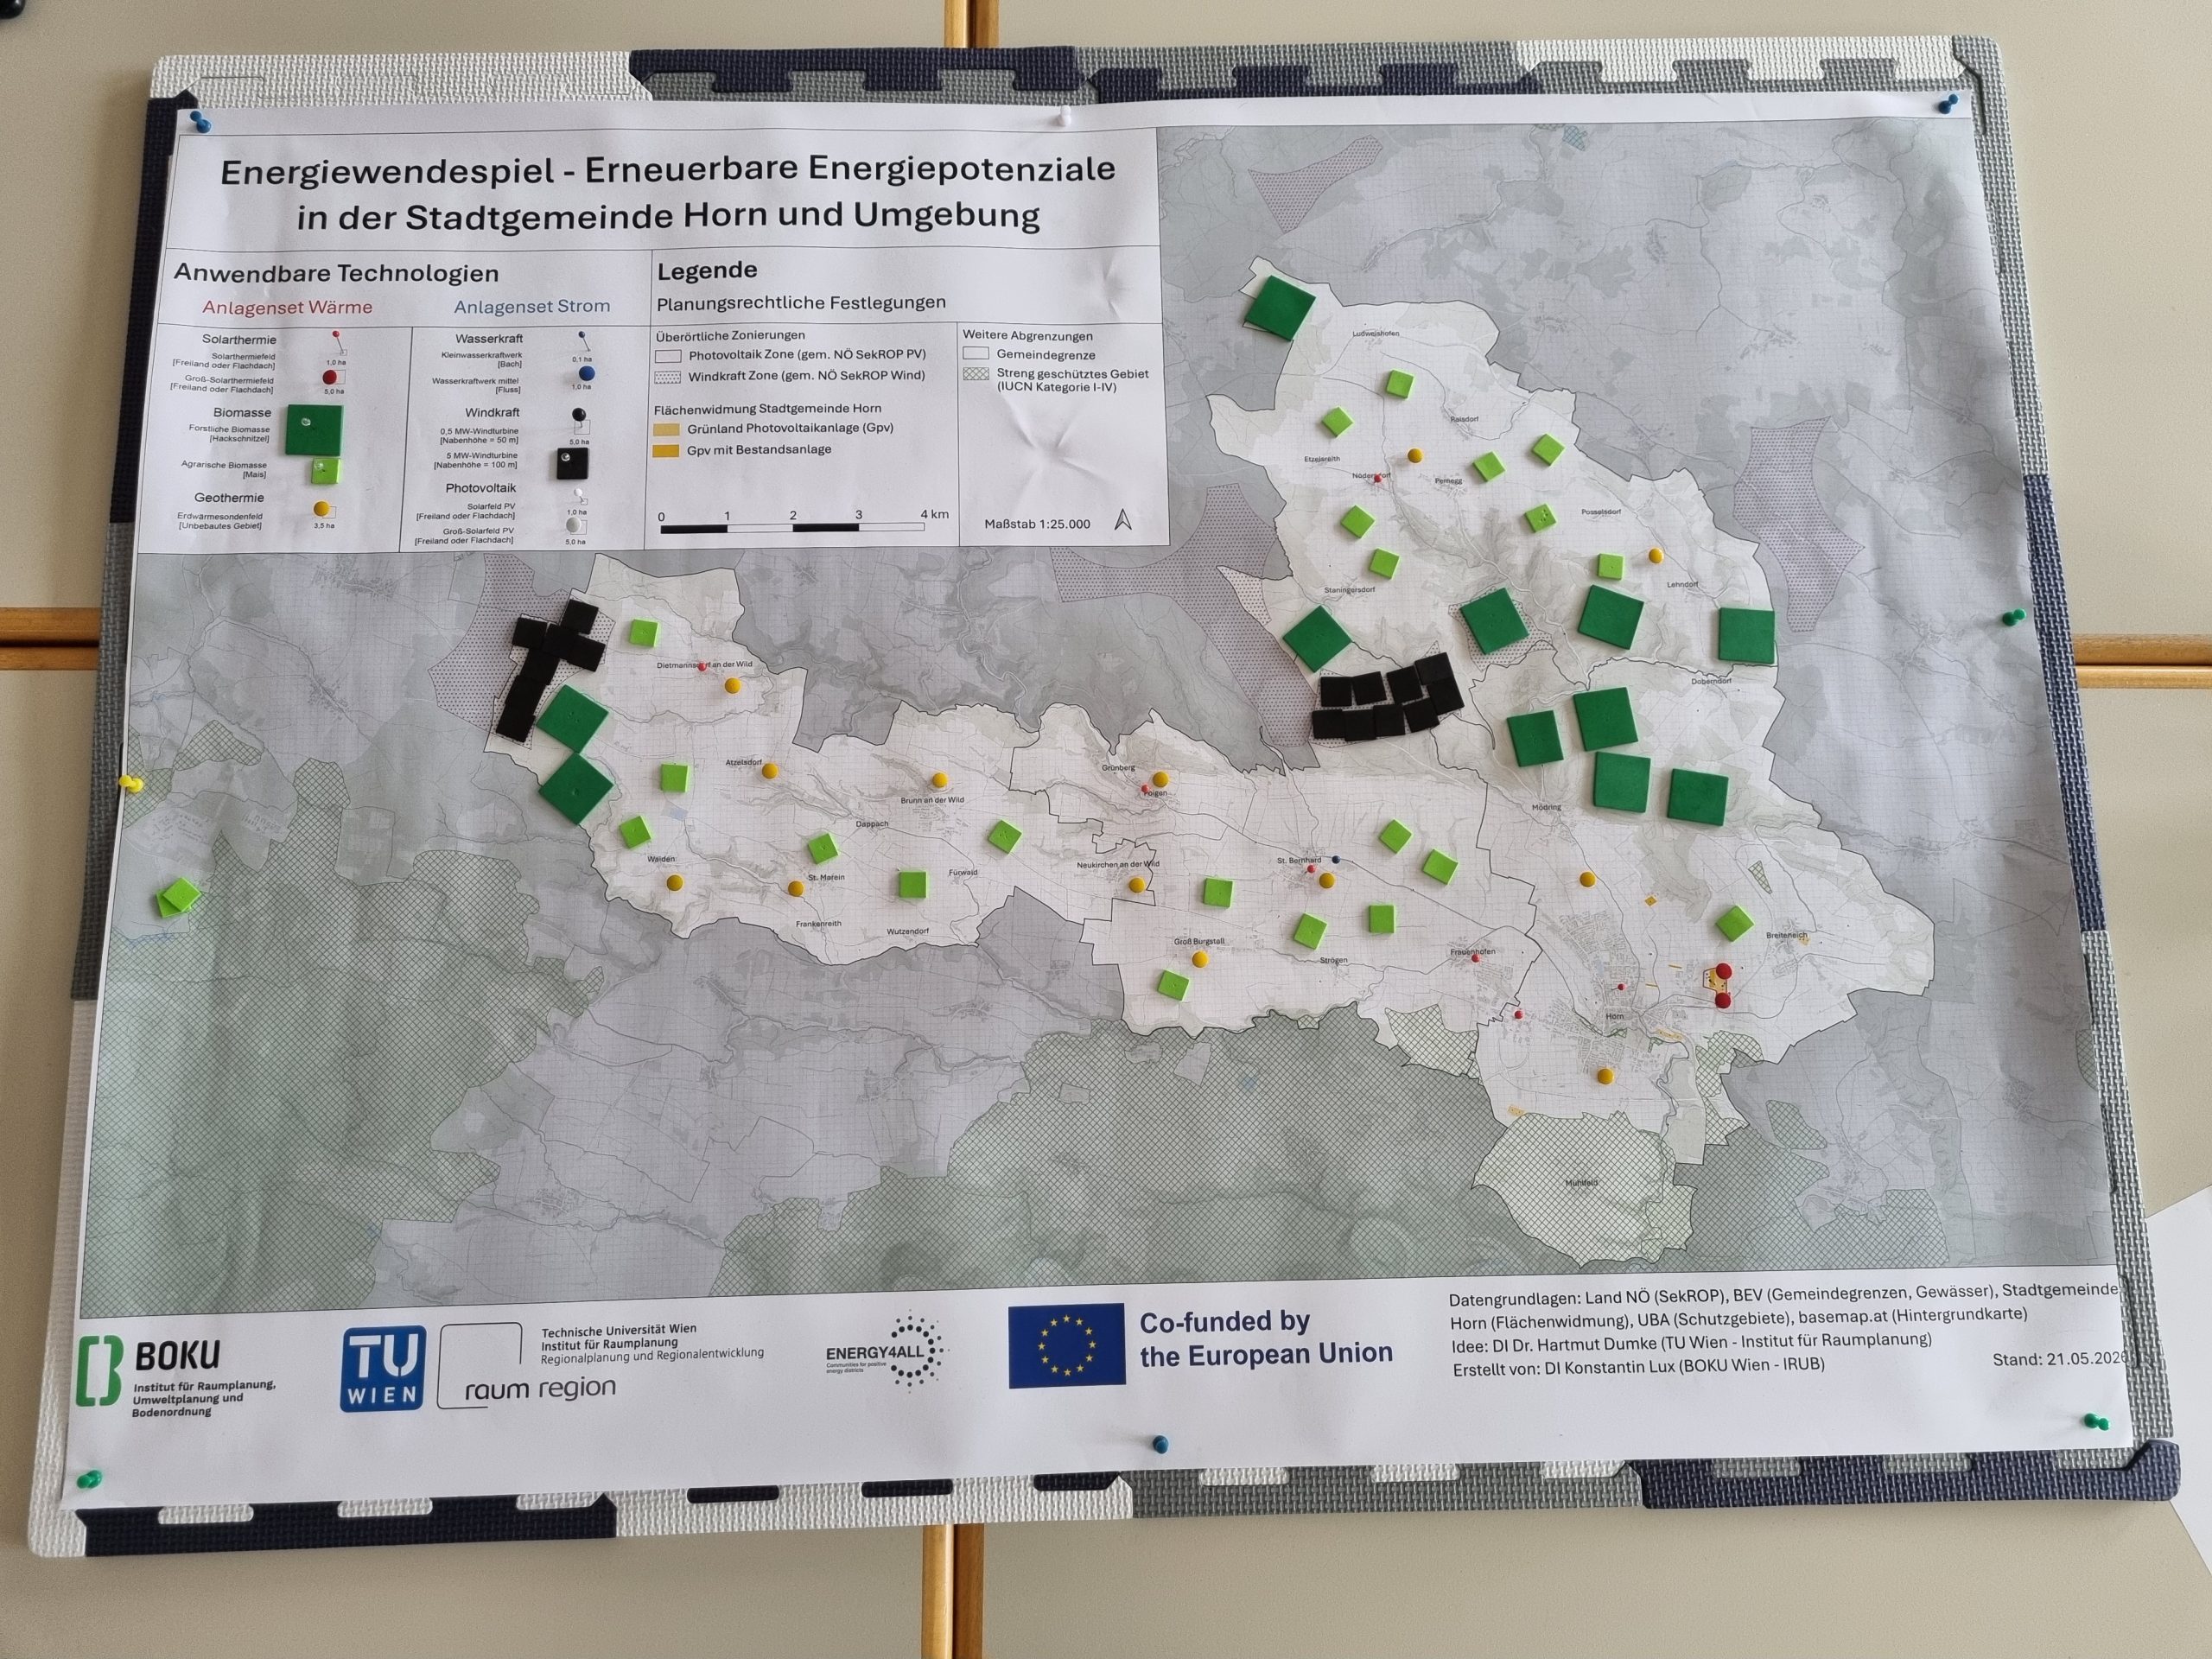
We pursued the further development of the Energy Transition Game for both use cases, although the needs of the two target groups seemed to be very different. On the one hand, we increased the complexity by integrating air-source heat pumps into the facility set, so that we could address current developments with expert audiences. We also created several monthly demand profiles that represent different characteristics of municipalities, such as winter tourism or industrial communities. On the other hand, the game had to become easier to understand so that children could use it too.
For this reason, the revision focused in particular on how the key parameters are presented (descriptions of facility configurations and properties, energy quantities, etc.). Instead of a plain spreadsheet view, we developed a digital dashboard (displayed in the browser) that presents clear graphics, for example on energy demand, generation profiles and the land requirements of the generation technologies. We also introduced two game modes: a “Standard” mode, in which the annual balance must be covered, and an “Expert” mode, in which the target is too cover monthly distribution.
The new digital dashboard also makes gameplay smoother. Adding a new facility to the game board (map) can be transferred to the dashboard with a single mouse click and immediately updates the graphics. The contribution of each new facility is thus captured and visualized directly as part of meeting the demand.
In addition, we fundamentally revised the map display of the game board, in terms of both content and visualization. By adjusting colours, line weights, hatching and transparencies, we achieved a harmonious, easily readable map image that works independently of the region.
At the same time, we made sure to use data sources that are as consistent as possible across Austria. Availability depends heavily on the topic, but we were able to do this for administrative boundaries, water bodies, buildings, protected areas and forest. Specific contents, such as priority zones for agriculture (or other uses) and existing renewable energy facilities on open land, still have to be collected and mapped on a case-by-case basis.
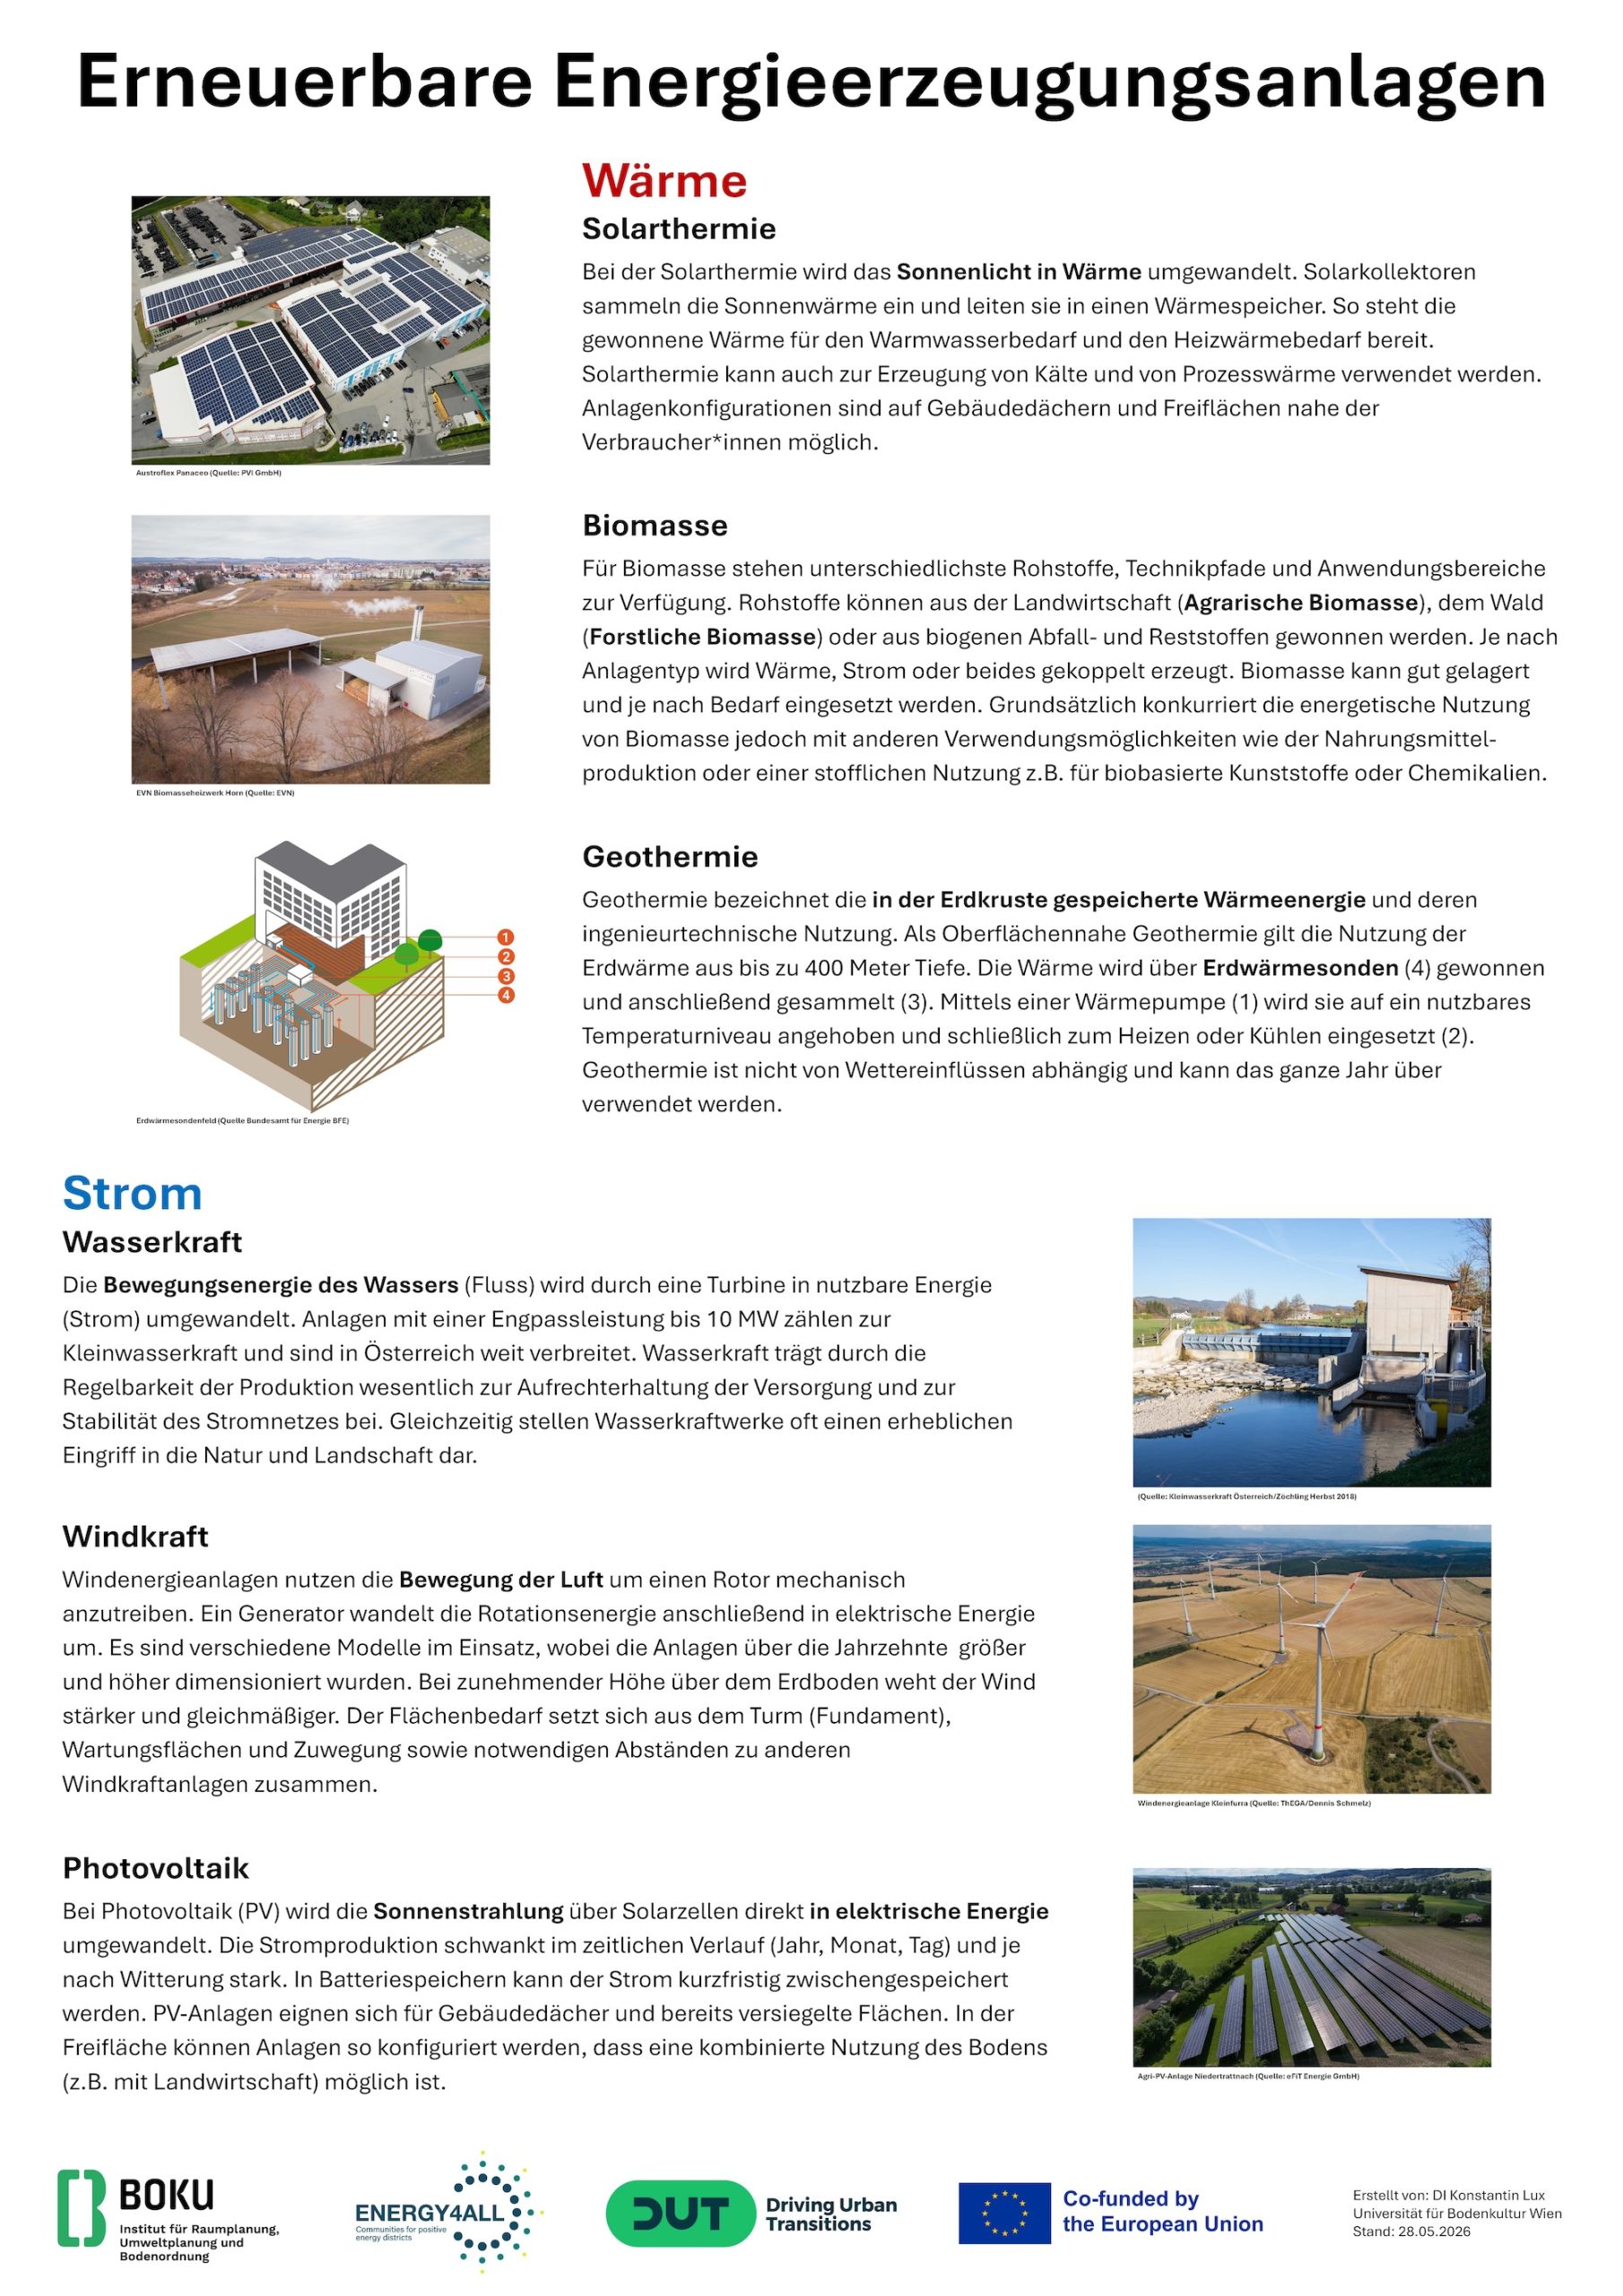
To make the facility set easier to understand, we created a poster as accompanying material. It illustrates the different technologies with images and describes their main characteristics in text.
During the development of the Energy Transition Game, several versions were used in university courses with students. We collected feedback on the current state of the game through a survey, and the suggestions for improvement were incorporated into the next revision. In this way, the development steps were regularly fed back to potential users, and the development was designed as a process with multi-phase loops.
Results from University Teaching
In total, 75 students were surveyed. Responses were collected as ratings on a 5-point Likert scale or as free text (partly with predefined answer options).
85% of participants stated that they were already moderately to completely familiar with the topic of energy transition. Nevertheless, students consistently reported a strong learning effect. Only one person said they had learned hardly anything new, while the majority gained a lot (to very much) additional knowledge. Energy demand (scale, spatial distribution, etc.) surprised players the most.
The overall rating of the game was very positive: 93% of respondents (70 people) gave it 4 (good) or 5 (very good) points. In line with this, 33% of participants found the game rules and procedure easy to understand, and 56% found them very easy to understand. For feedback on the dashboard and the content of the gameboard (map), a change is visible between earlier and later surveys. During the sessions in March and April 2026, a few negative ratings (1 or 2 points, i.e. “strongly disagree” or “disagree”) were given in regard to the readability and practicability.
The written feedback concerned both the presentation and the content of the game. For example, the visualization of rivers on the map was criticized:
“The river placed on the Map was not clear for me”
The performance (responsiveness) of the dashboard also had to be adjusted several times:
“The digital dashboard needs improvement”
Regarding the game content, participants most often asked for current technologies:
“Heat pumps are missing; industrial potentials, e.g. for waste heat, would be exciting”
We took this feedback on board and gave these aspects special attention in the further development. The survey results confirm that the adjustments were successful: in the sessions in May and June 2026, no negative ratings (below 3 points) were given in this regard.
Participants reported particularly strong learning effects regarding the interplay of the various aspects of the transformation process and the dimensions involved, in terms of both energy quantities and land area:
“The most valuable lesson was realizing how interconnected everything is. Energy production, land use, transportation, ecology, and community needs cannot be planned separately; a change in one system affects all the others.”
and
“how much each technology contributes to energy generation, how much we actually need to build to achieve 100% [renewables], and that the difference between months (winter vs summer) is so big”
The Likert-scale ratings confirm this. Asked whether the game helped them better understand the interrelations and trade-offs of the energy transition, 47% (35 people) agreed and 28% (21 people) strongly agreed. One participant praised the game in this respect:
“A clear overview of the impact of decisions.”
Only two participants would be unlikely to recommend the Energy Transition Game; everyone else would. Respondents rated its suitability for school classes (80%) and decision-makers (69%) particularly highly.
Further Use Cases
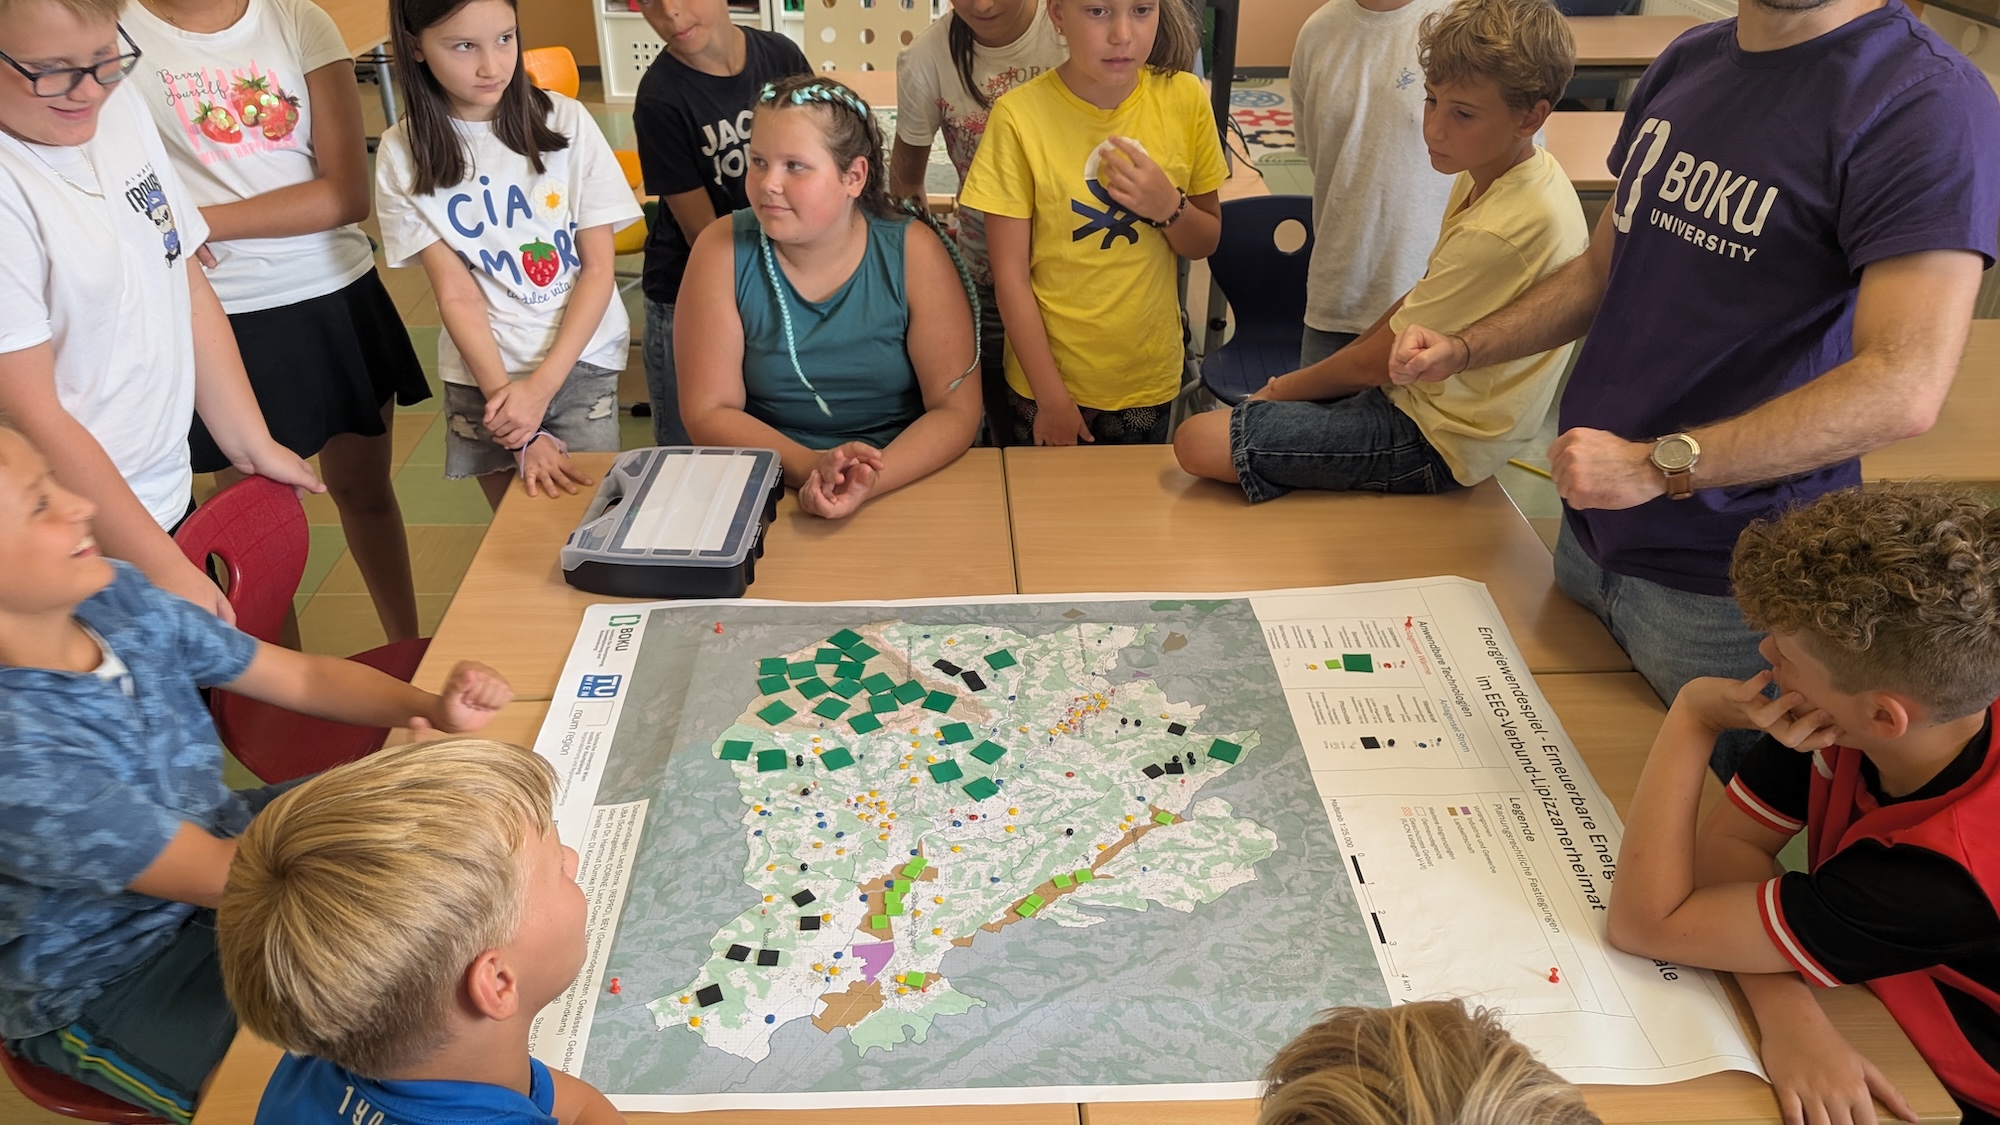
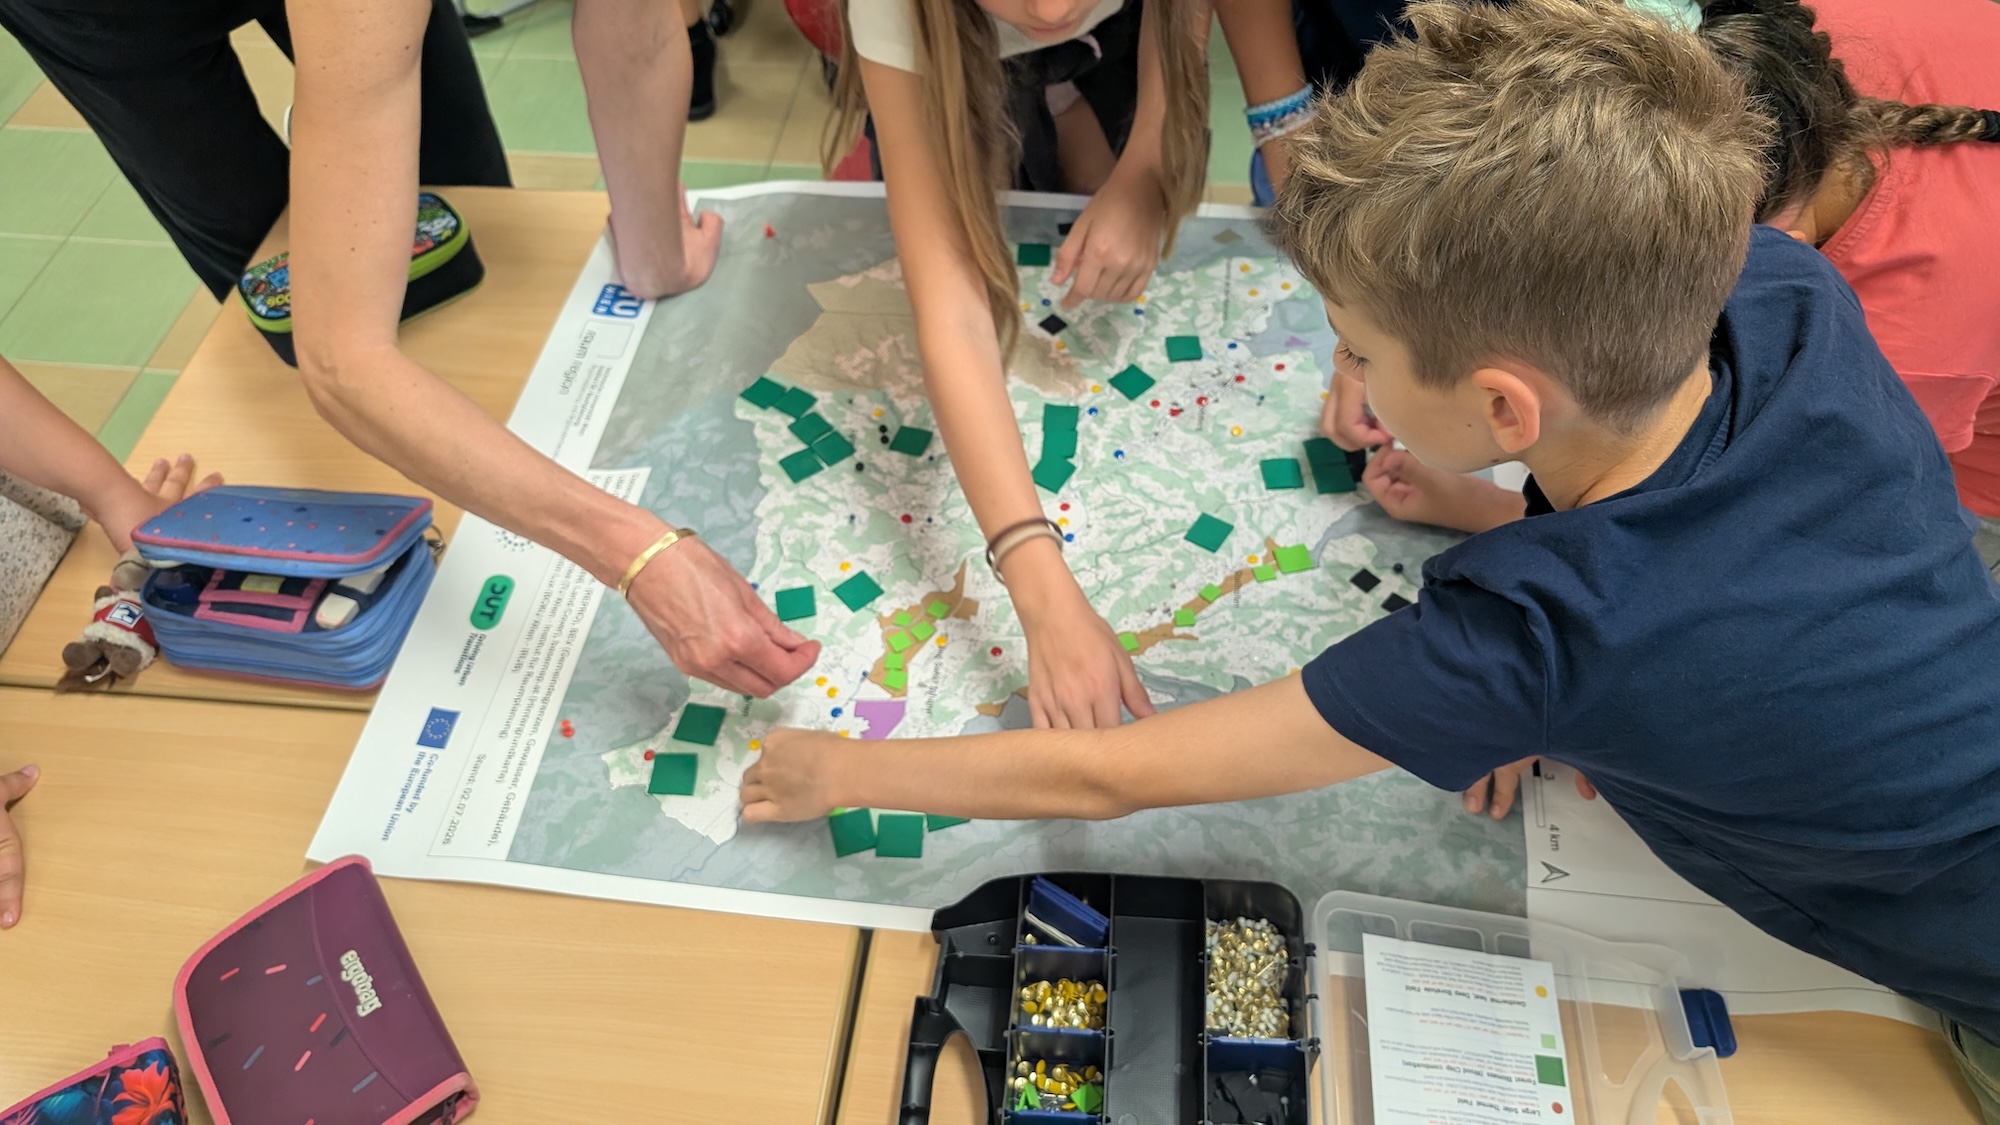
In April 2026, an interim version of the Energy Transition Game was presented to the public during the Long Night of Research. We imitated the workshop setting at BOKU University so that interested visitors could try out the game. Three experts from the Institute of Spatial Planning, Environmental Planning and Land Rearrangement led the game rounds and answered questions. Another time the setup was used at the “climate Festival” in Graz (May 2026), where the Energy Transition Game was once again available for the public to try out.
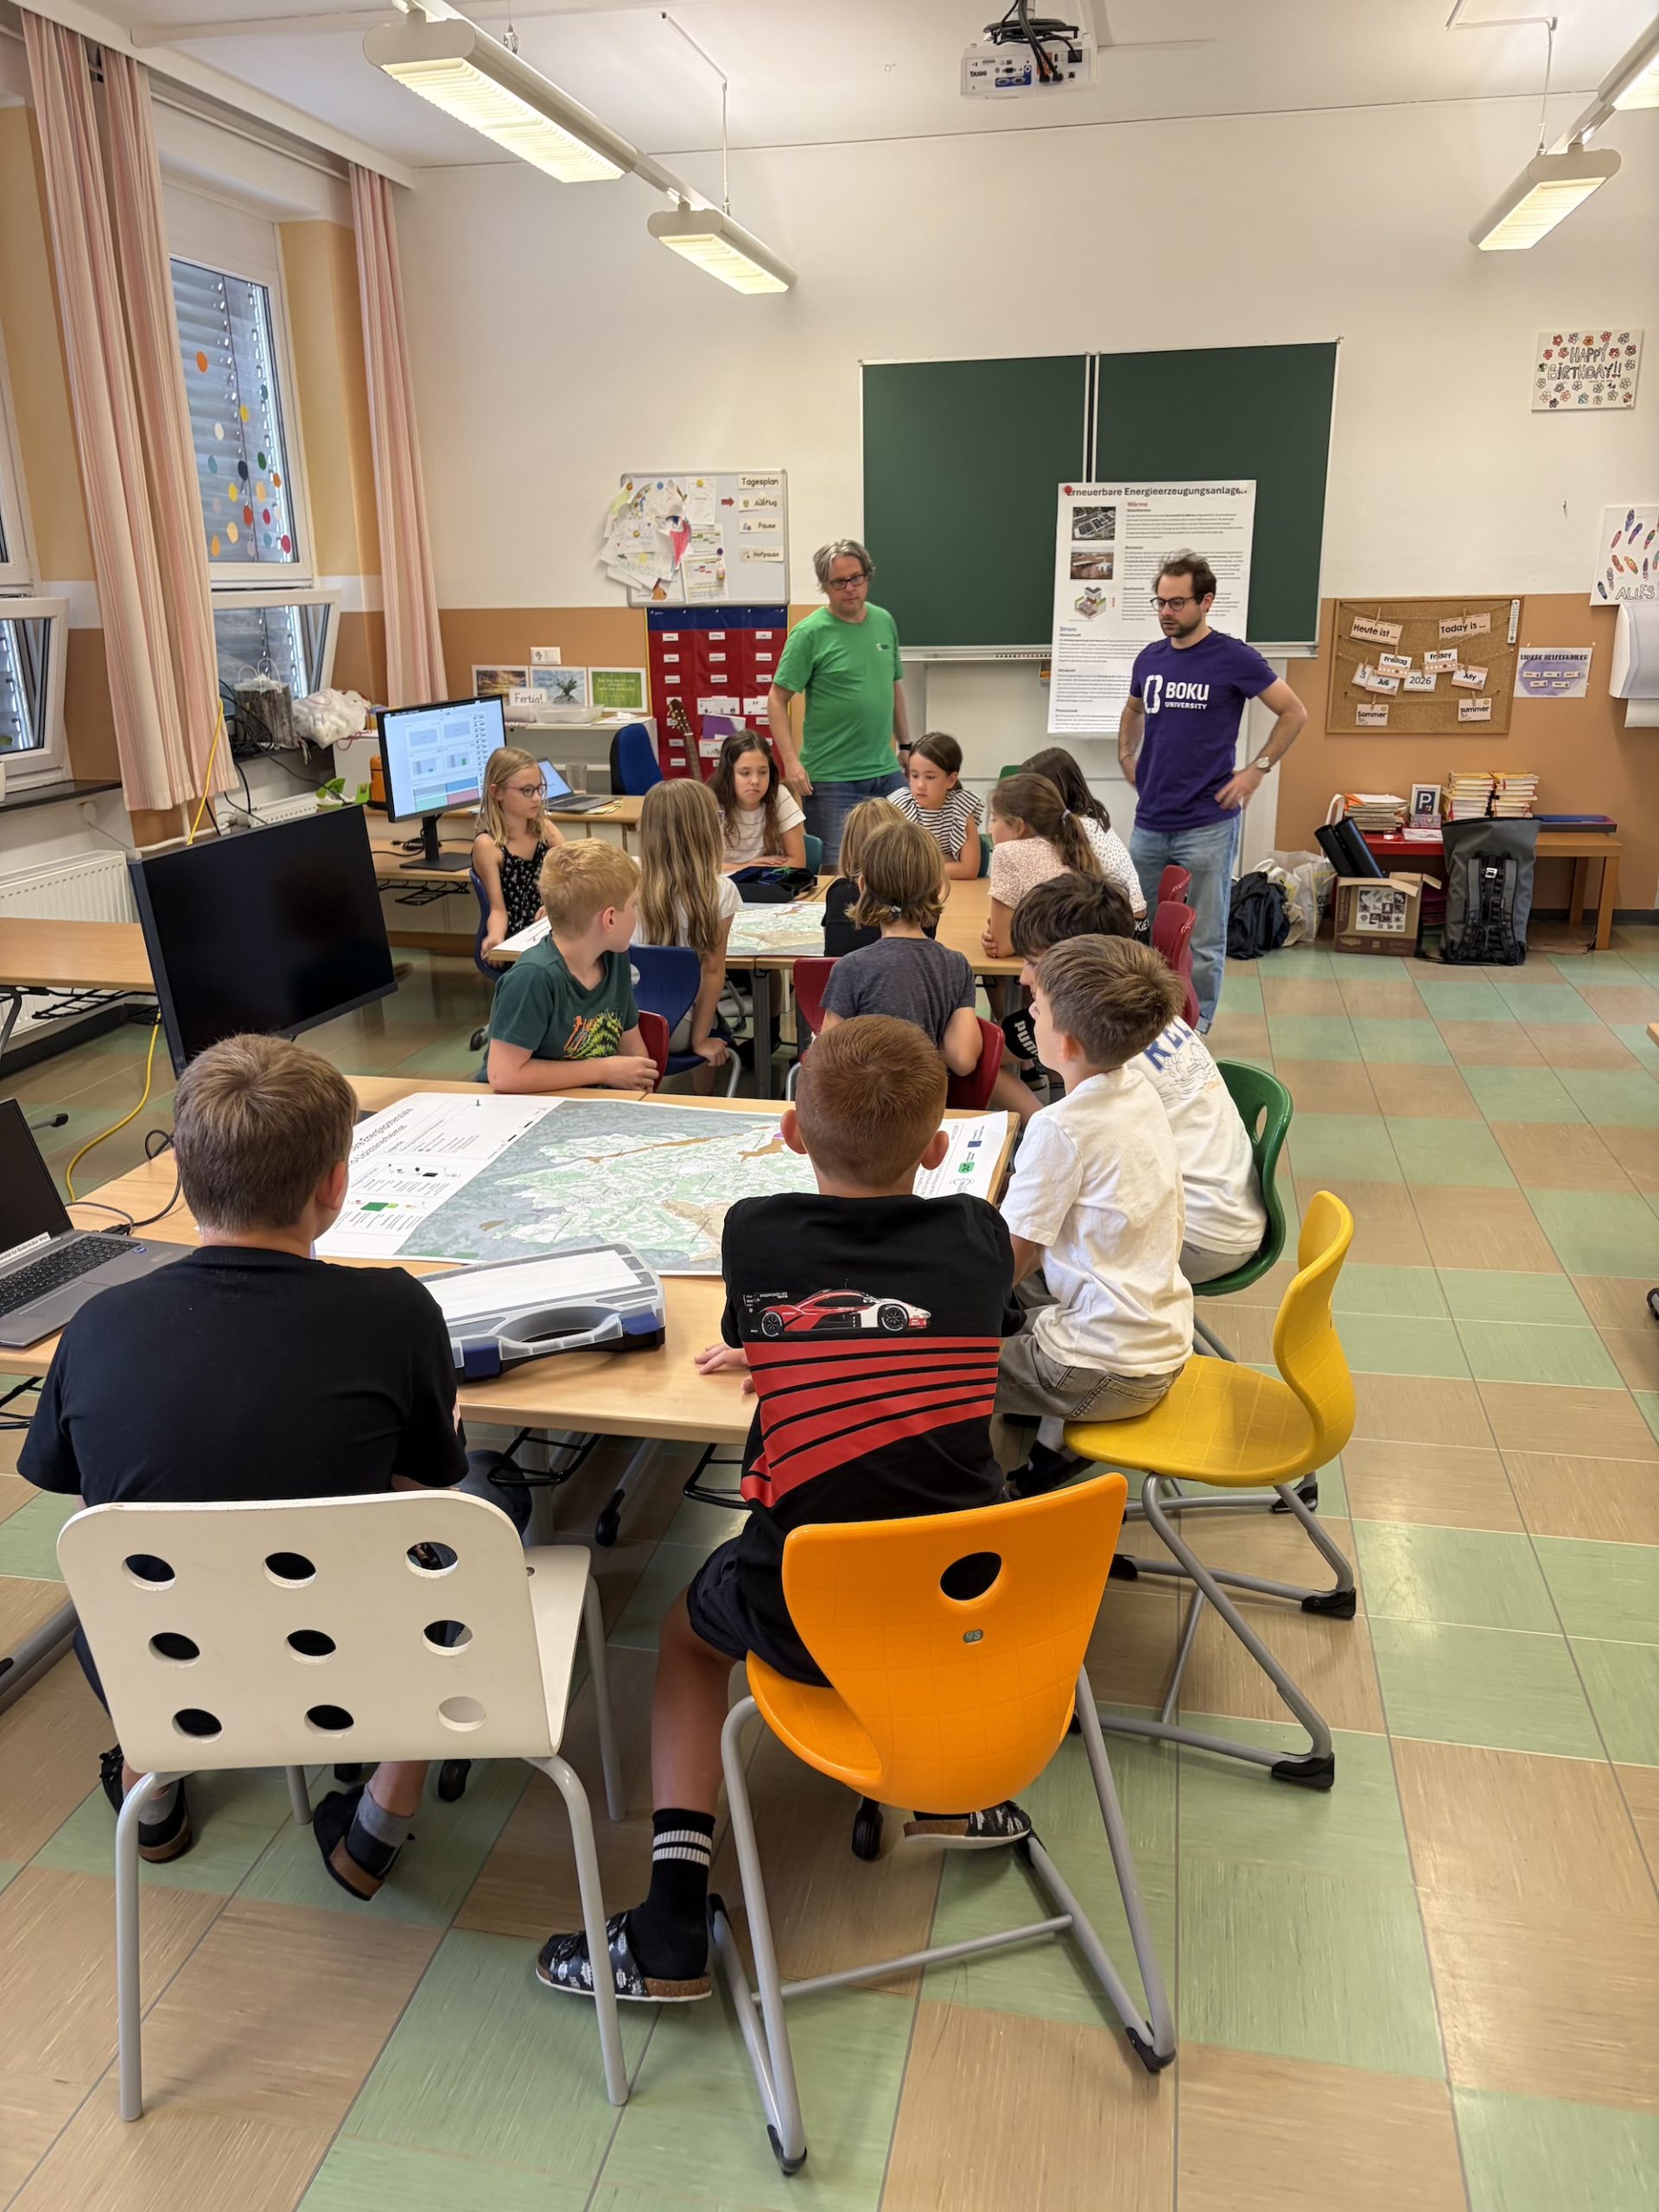
Most recently, in July 2026, the game was used in school classes.
In several game rounds with fourth-grade primary school children, we tested how understandable the contents, the procedure and the objective of the game are.
A key finding from using the Energy Transition Game with primary school classes (4th grade) is that the detailed mode with monthly energy balances is also relevant for this target group. The children eagerly tried to cover the energy demand across the entire year, keeping in mind the marked difference in heat demand between the seasons. The playful approach and familiar places on the game map quickly sparked interest in the game and the task at hand. The children were able to relate to the energy transition and see its relevance through their own living environment and with the help of the technologies shown on the accompanying poster.
Conclusion
As a development team, we draw several conclusions from the process. First, we succeeded in developing the Energy Transition Game using the input from the feedback loops. It is natural that only part of the criticism is valuable for further development. We looked more closely at frequently mentioned points and adjusted them where possible. Others could not be addressed, for example the comment on scale:
“The scale of the grid”
This contradicts the development team’s approach of thinking about energy transition scenarios at the regional level rather than limiting them to individual municipalities. The relationship between energy-intensive and less energy-intensive areas manifests spatially, which can better be shown across municipal boundaries.
The tool was originally meant to be specialized and differentiated for several use cases, which leads to the second point: it turned out that one and the same tool is suitable for different target groups. Differentiating the level of detail is not necessary as long as the framework conditions are designed accordingly. With schoolchildren and laypeople, the different generation facilities need to be explained in more detail beforehand, but the basic structure and flow of the game can stay the same. With students from related fields and with experts, on the other hand, a quick start into the game is possible, and the game itself can then include more extensive discussions about specific sites and suitability factors.
Finally, we found that the public knows more about the energy transition than the project team expected. Many participants, including the school setting, had specific questions for the game facilitators about facility configurations and the like. This makes the further development of the Energy Transition Game even more successful, since participants still consistently reported a strong learning effect.
See the other article
October 28 - 2026
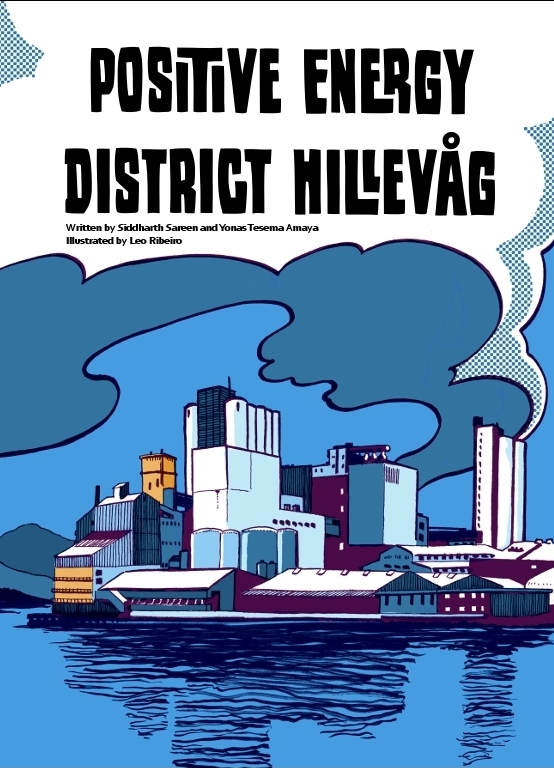
ENERGY4ALL? Public talks and panel discussion on Positive Energy Districts in Stavanger and Europe!
The ENERGY4ALL project hosts European partners for a consortium meeting to close three years of successful collaborative research and innovation on Positive Energy Districts, or PEDs. Across Norway, Austria, Italy and Hungary, we have piloted and researched PEDs as part of growing momentum for renewable energy communities in European cities and neighbourhoods.
October 21 - 2026
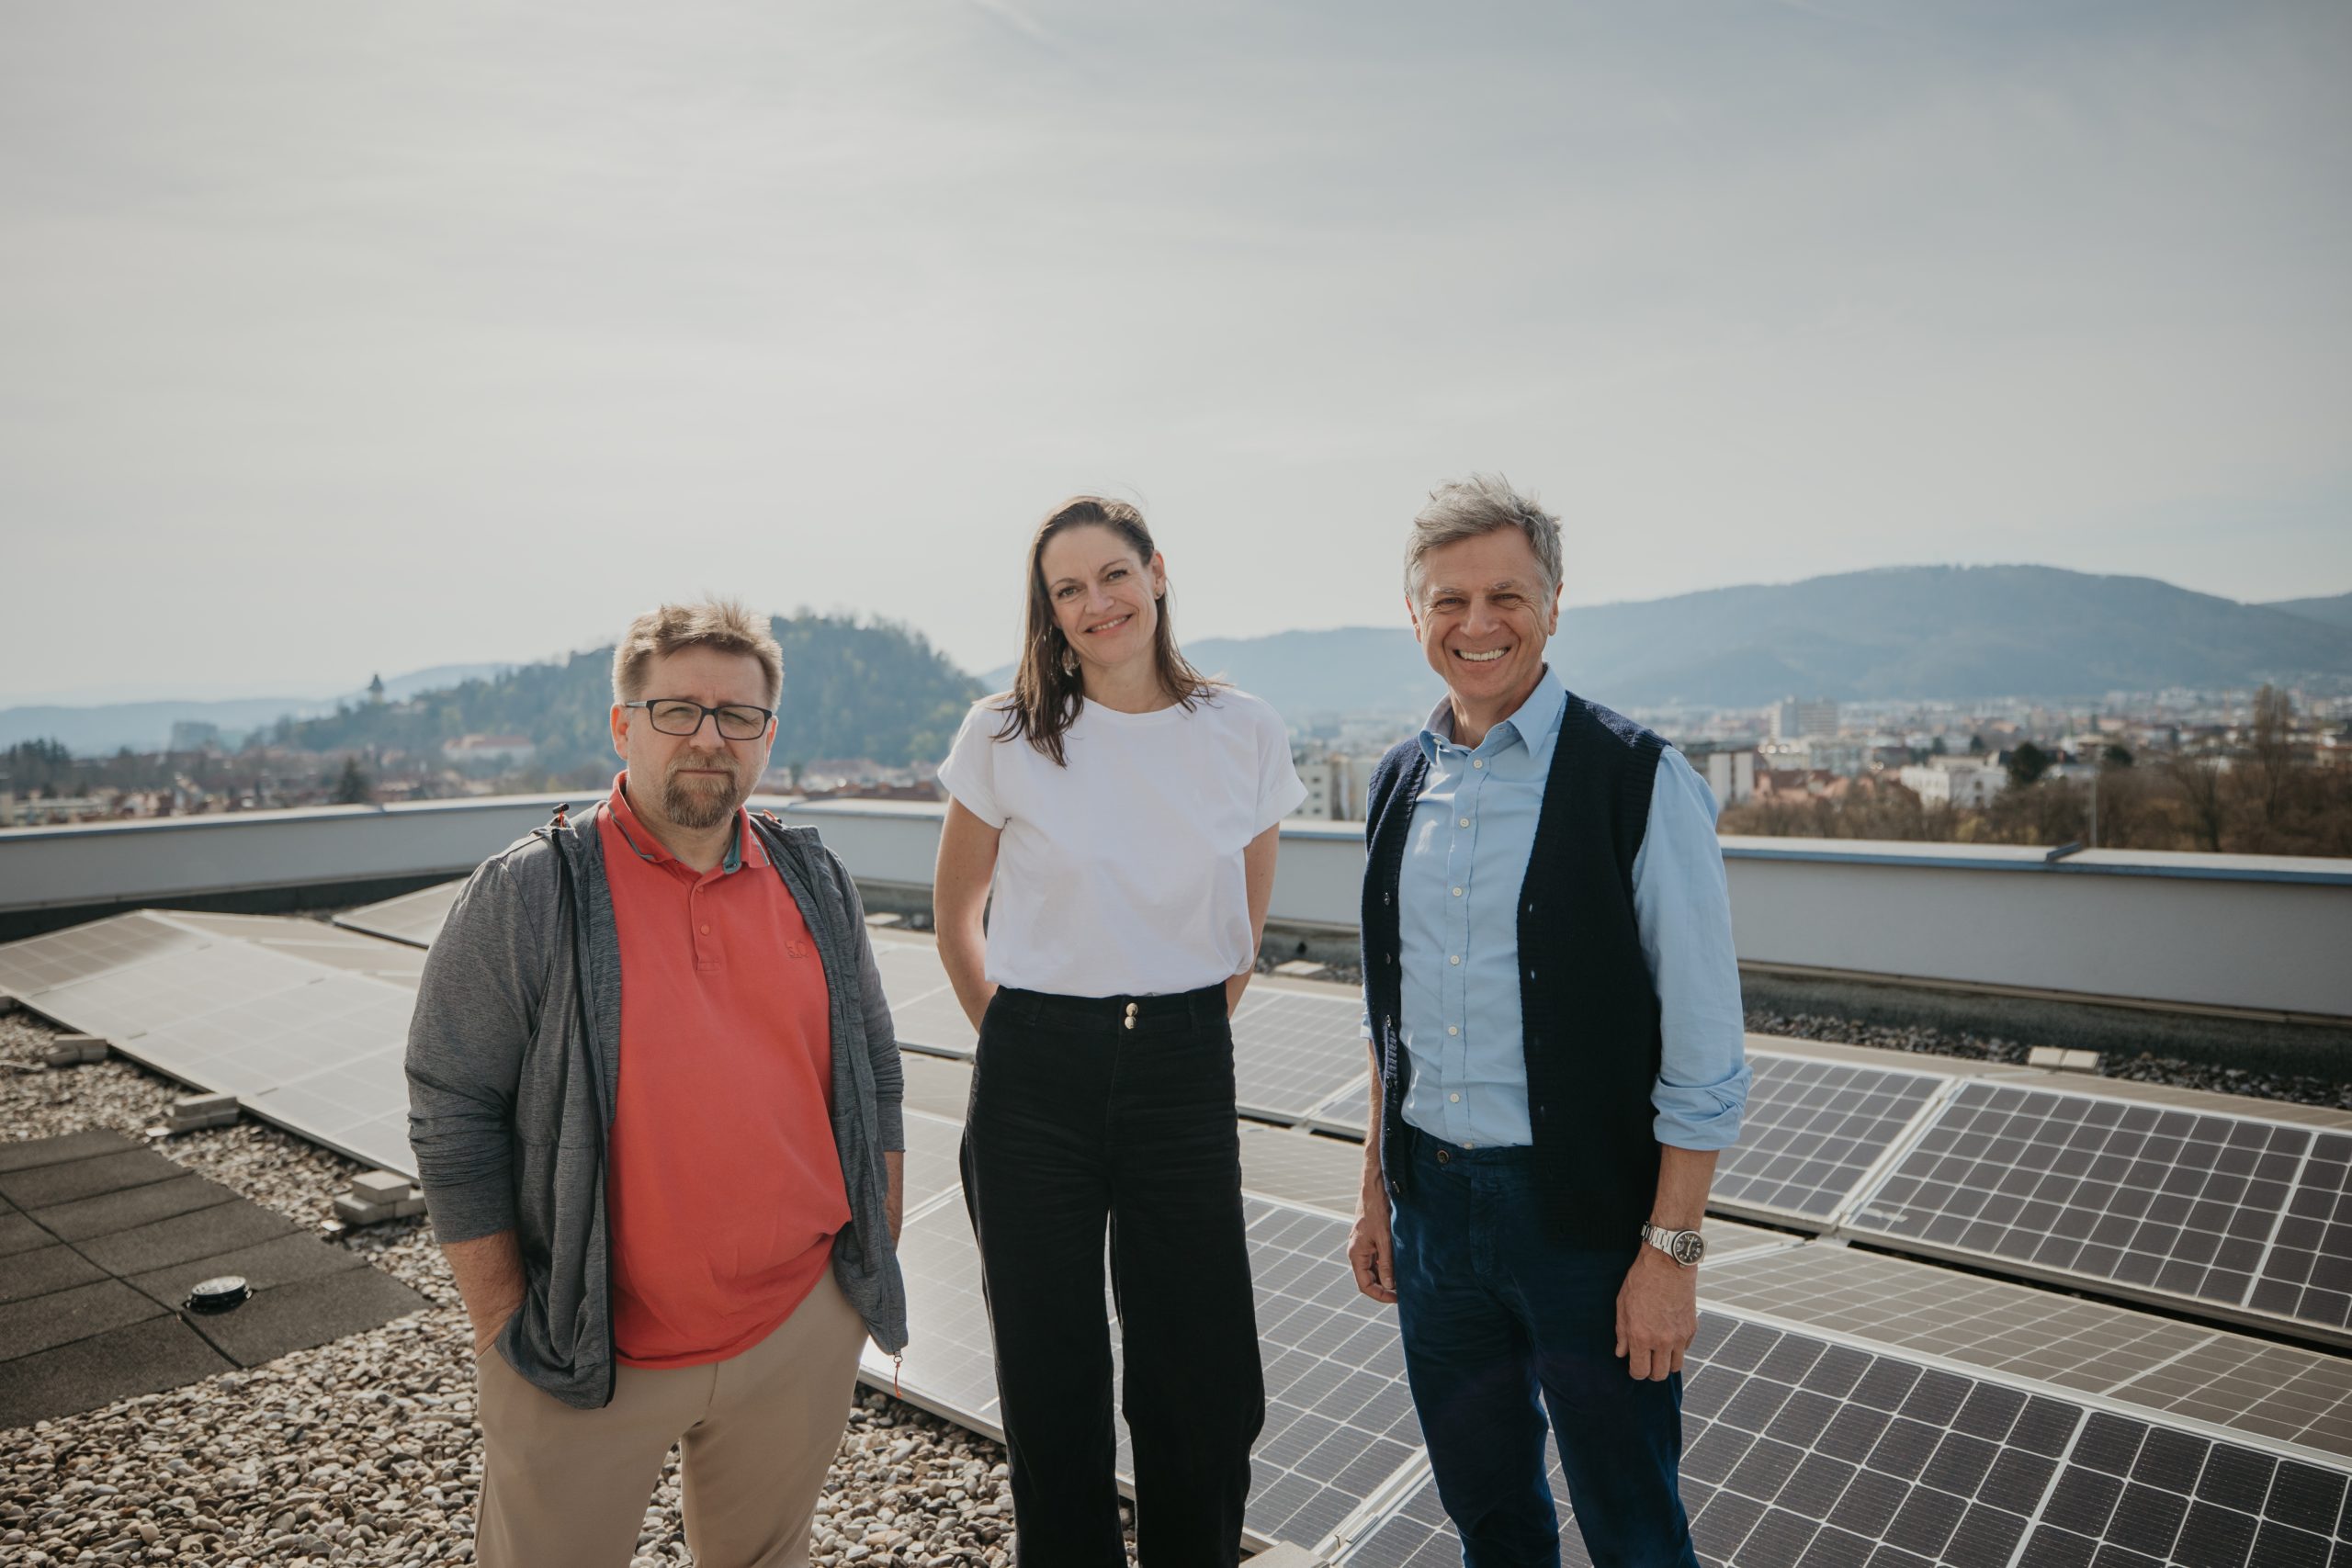
What It’s Like Working with Energy Communities in Austria: An Insider’s View with Cornelia Desimini
Cornelia Desimini, deputy chair of EEG Verbund Lipizzanerheimat, explains how Austrian energy communities keep money in the region, and why their biggest challenge is finding enough consumers and a more diverse membership.
October 9 - 2026
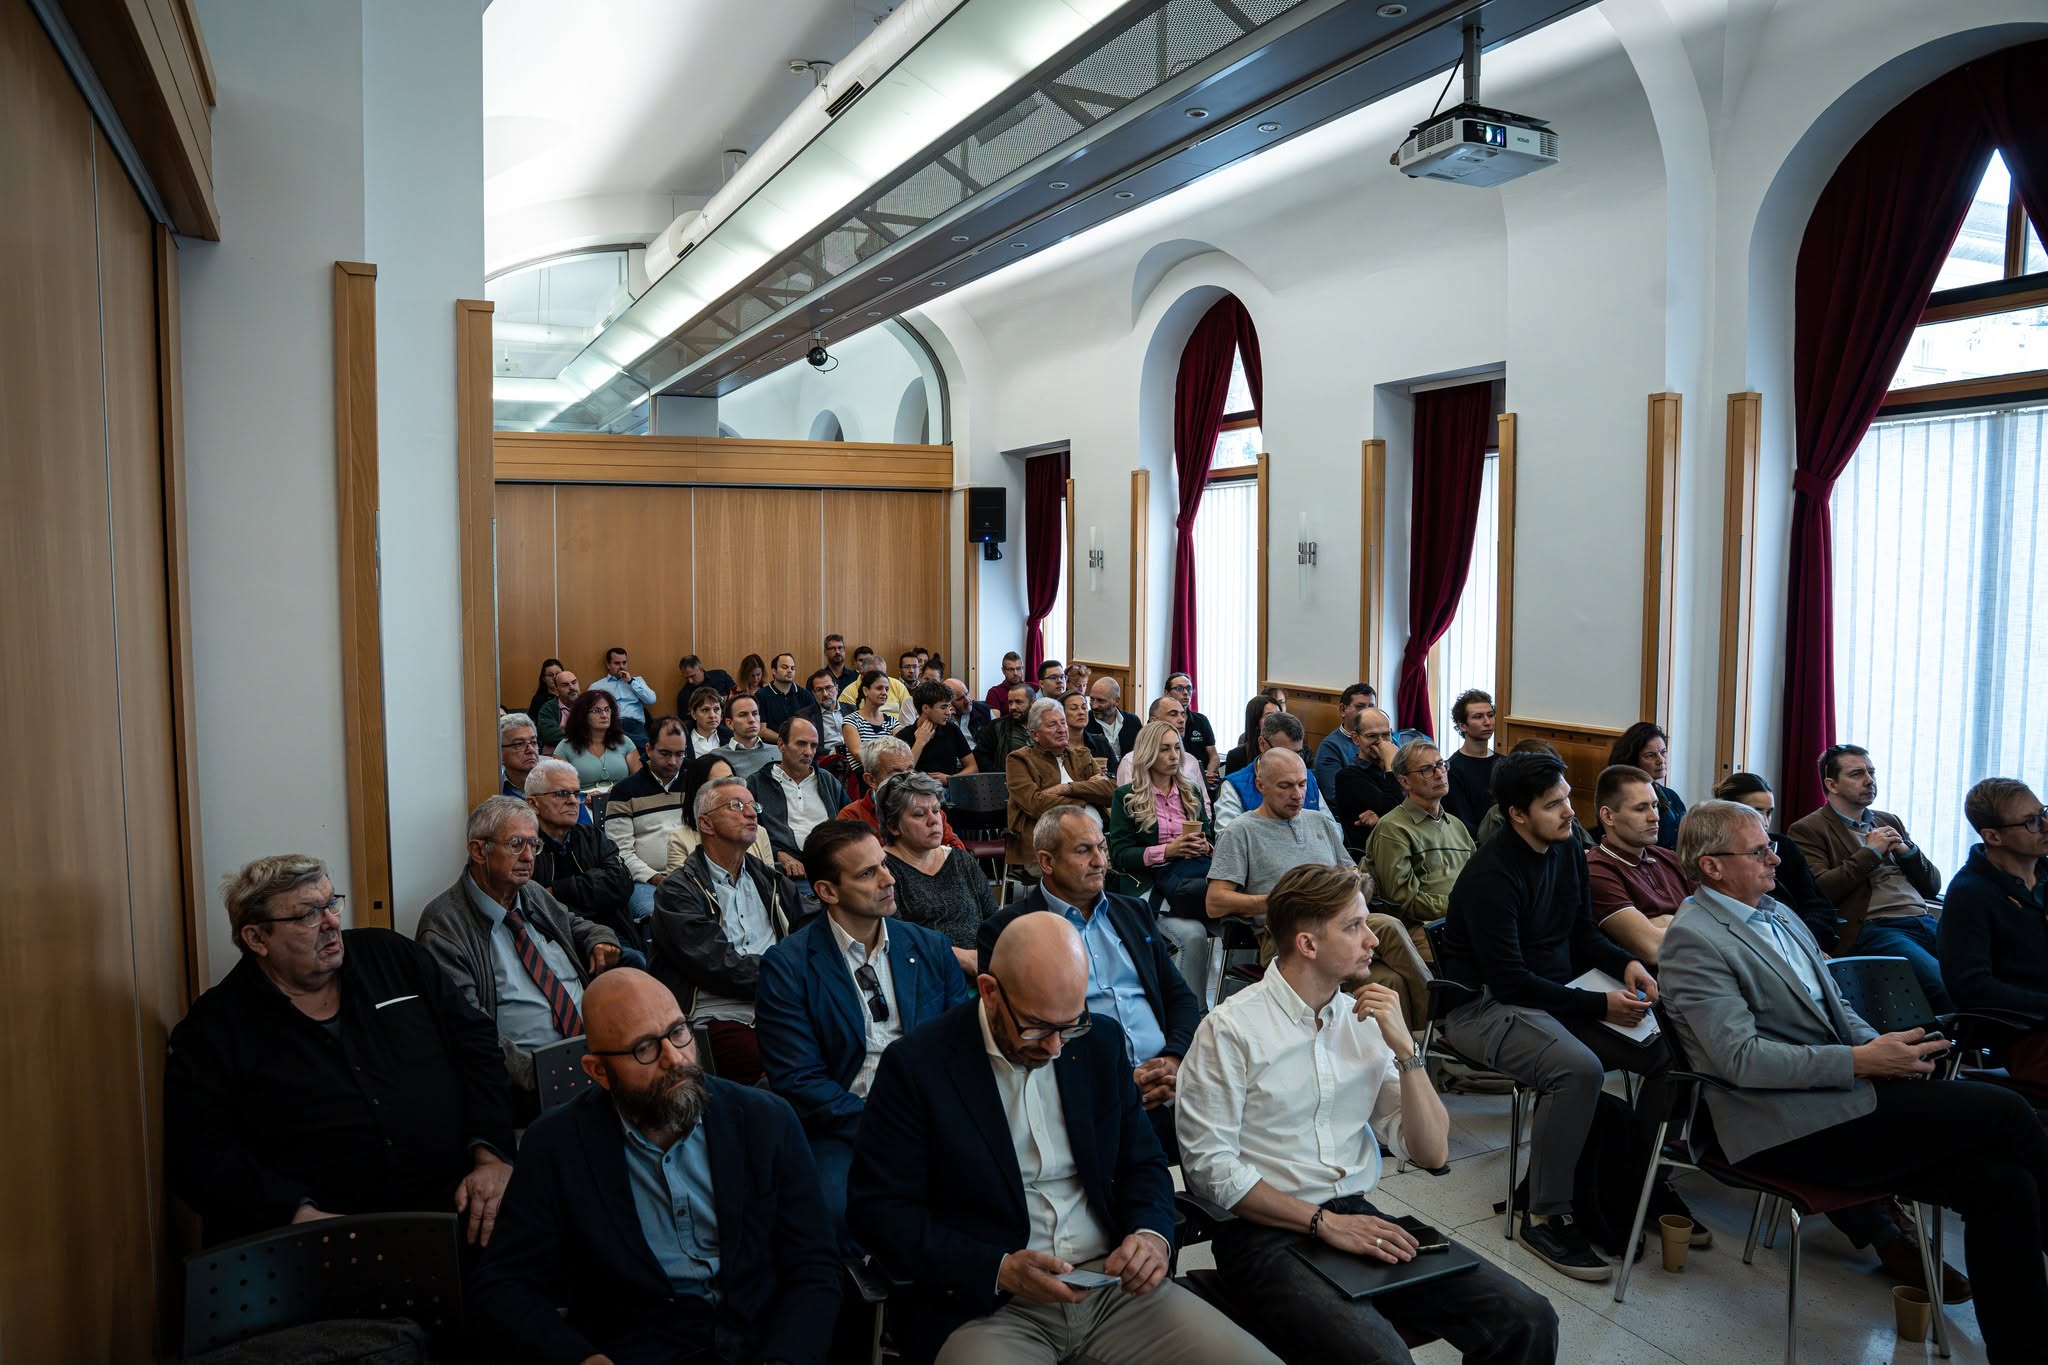
4th Energy Community Conference, Community Energy: New Opportunities?
On 7 October, our Energy4All partner, the Centre for Solidarity Economy (SZGK), co-organised the 4th Energy Community Conference, Community Energy: New Opportunities?, together with Transzformátor and the Hungarian Federation of Energy Communities.
September 14 - 2026
New policy article
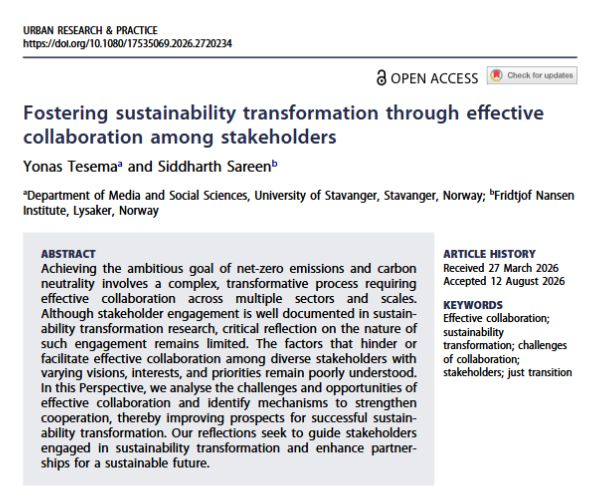
Fostering sustainability transformation through effective collaboration among stakeholders” explores how collaboration among stakeholders can support sustainability transformation, and what factors enable or hinder effective collaboration and collective action.
July 22 - 2026
The Energy Transition Game empowers kids for a sustainable future – Workshops by BOKU & Austrian ECs schools
The "Energy Transition Game" transformed the elementary school in Ligist, Styria, into a renewable energy hotspot through workshops developed by BOKU University as part of Energy4all, focusing on knowledge transfer, raising awareness and community building among children, teachers and parents.
March 11 - 2026
The Human Cost of Net-Zero: Analyzing Stavanger’s Hillevåg PED Project
Stavanger’s Hillevåg Positive Energy District aims to produce a surplus of renewable energy while supporting climate-neutral urban living. However, the project also reveals socio-economic tensions between ambitious sustainability goals and local concerns about preservation and community impacts.



Share on