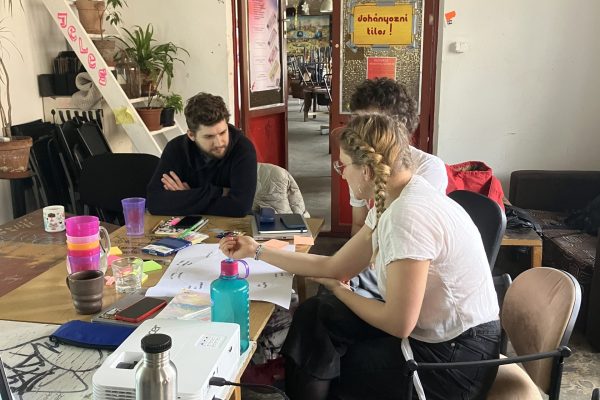
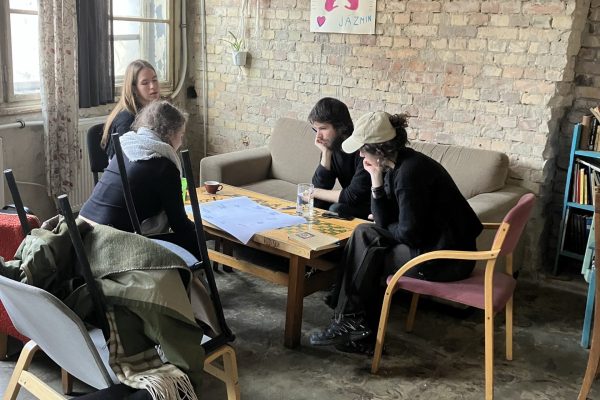
On March 12, 2025, the second in-person workshop of the Kazán Energy Community (Kazán EC) took place—an engaging and insightful session where members collaboratively mapped out one of the central challenges facing their community. The workshop was led by ABUD and involved a focus group of Kazán EC members invited by Solidarity Economy Center (SEC) and a representative from the Municipality of Budapest. It took place as part of the Energy4All research project, exploring the role of communities and the human dimension in designing and implementing Positive Energy Districts (PEDs) and Energy Communities (ECs).
The core activity of the day was the creation of a Causal Loop Diagram (CLD), a systems thinking tool that helps us visualize complex problems and the interdependencies within them. But what exactly is systems thinking, how do CLDs work, and what did we learn from this workshop?
What Is Systems Thinking and a Causal Loop Diagram?
Systems thinking is a method for understanding and addressing complex problems by looking at them holistically. Rather than breaking problems into isolated pieces, systems thinking examines how various factors are connected and influence each other over time. This approach is particularly useful in contexts involving human behavior, societal structures, and long-term dynamics—such as in energy communities.
A Causal Loop Diagram (CLD) is one of the key tools in systems thinking. It is a visual representation of a system’s elements (called variables) and how they influence each other through cause-and-effect relationships. Arrows connect variables, showing whether the relationship is positive (they change in the same direction) or negative (they change in the opposite direction). These relationships form feedback loops, which can either reinforce (amplify) or balance (stabilize) the system.
CLDs are especially helpful for:
- Creating shared understanding among stakeholders of a problem
- Identifying leverage points for interventions
- Supporting strategic planning and collective decision-making
Causal Loops Diagram mapping the factors relating to energy cost reduction, developed at Kazán Energy Community’s Second Workshop. Image © ABUD.
Methodology: Steps to Create a CLD
The methodology used in the Kazán EC workshop followed a structured five-step process:
1. Define the Core Problem
The first step is to agree on a central, dynamic issue the community wants to address. In the case of Kazán, the focus was on reducing energy costs, a concern that evolves over time and has multiple contributing factors.
2. Identify Variables
Participants brainstormed variables that affect the core problem. These included both technical (e.g., “PV capacity”) and social factors (e.g., “motivation to participate”). Each idea was written on post-its and clarified to ensure a shared understanding.
3. Create Connection Circles
Using the top 10 variables, the participants created diagrams that mapped out the relationships between variables. This helped identify drivers (variables with many outgoing arrows) and outcomes (variables with many incoming arrows).
4. Draw the Causal Loop Diagram
Building on the connection circles, participants worked together to develop a comprehensive CLD using a Miro board. Arrows were added one by one, with each connection being debated and clarified. The diagram included feedback loops and time delays, helping to surface the systemic structure behind energy costs.
5. Next steps
After the workshop, ABUD reviewed and complemented the CLD, where necessary, and digitalized the results. A future analysis will help identifying feedback loops and leverage points – areas where interventions could have the greatest impact -, and action ideas.
Looking Ahead
The CLD developed in this workshop is more than just a diagram—it’s a shared mental model of the factors that impact energy costs within the Kazán Energy Community. It lays a strong foundation for identifying impactful interventions and designing collective actions.
The other E4A pilots were also asked to create a CLD that focuses on their own core problem. By comparing and contrasting these different CLDs, ABUD will be able to create generalized recommendations for founding and improving Energy Communities in the future.

Share on